Definitions
Systems consist of elements and their interrelations or linkages. The relations between elements have received ever more attention in science, reinforced by the advent of ICT and in its applications in social media and AI. In particular information flows connecting elements are of great societal relevance. As Harari (2024) warns: “… humankind gains enormous power by building large networks of cooperation, but the way these networks are built predisposes us to use that power unwisely. Our problem, then, is a network problem.”
The theory which focuses on the interrelations or linkages between elements is called network theory. It is of great help to understand how systems behave and is being applied to a large variety of systems, from ecosystems to electrical and information systems.
A network is defined as a set of system elements. The elements are called vertices (or nodes) and the links are called edges (or links) connecting vertices, but there are different names in different fields (Table A10.1). The number of vertices, n, is called the size of the network. In first instance, the analysis of a network is a description of the vertices and edges and an examination of the properties of the network. A fundamental property is the degree of a vertex. It is the number of edges to or from that vertex. A plot of the fraction of vertices of a certain degree as a function of the degree is called the degree distribution.
The edges represent some kind of exchange (goods, influence, progeny and so on) and may be assigned directions, weights or sizes, as, for instance, in transport, trade or communication channels. The vertices may have a variety of properties, such as position in space, membership of a class (plants, animals, peoples, cities and so on) or characteristics of such membership (weight, age, metabolic rate, communication frequency, number of inhabitants and so on). If the vertices are used to formulate a square matrix and the value of edges is indicated in the cells, the matrix is called an adjacency matrix.
The degree of a vertex is the number of edges incident on, or connected to that vertex. The shape of the degree distribution is an important network property. It can be approximated with an analytic function Pk, which should be interpreted as the probability that a randomly chosen vertex has k connections. Strictly speaking, one should distinguish a histogram, that is based on empirical data, from its mathematical abstraction, that is called a probability distribution. When the distribution follows a power law, one gets a straight line for a plot of Pk as function of k on a double logarithmic or log-log scale. They are called power-law networks. They are also called scale-free networks because they remain unchanged under rescaling of the independent variable k with a multiplication factor m.
Another interesting large-scale property of networks is the mean degree z, which is defined as the average number of edges connected to a vertex. It equals the ratio of the number of edges and the maximum possible number of edges. The transitivity or clustering coefficient C indicates the extent to which ‘the friend of your friend turns out to be also my friend’. The community structure of a network is a measure of the presence of subgroups of vertices with a high density of edges within them and a lower density of edges between them. The resilience of a network is an indication of a network’s response to the removal of vertices. If vertices are removed, paths between connected vertices will become longer, and at some point, the vertices will become disconnected.
Newman (2003) collected data on a variety of networks and characterises four loosely connected categories (see Table):
- biochemical and bio/ecological networks: metabolic pathways, protein interaction networks, genetic regulatory networks, food webs, neural networks;
- technical and infrastructure networks: river and canal networks, road and railway networks and airline routes, electric power grids and telephone and Internet communication networks. Many of these networks are related to space- and geography-governed infrastructure and designed for distribution;
- information (or knowledge) networks: a classic example is the network of citations, more recent ones are the World Wide Web and networks of people’s preferences for objects used in targeted advertising; and
- social networks: intermarriages, sexual contacts, mail contacts, friendship relations, business and collaboration relationships, and influence networks of executives and politicians. The vertices are (groups of) people that are in some forms linked to each other. They overlap with communication and information networks.
| Table 1 Overview of systems that have been studied as networks a | |||||||
| Network | Type | No. of vertices n | No. of edges m | Mean degree z | Mean vertex-vertex distance l | Clustering coefficient C | If power-law distribution: exponent α |
| Metabolic | Undirected | 765 | 3,686 | 9.64 | 2.56 | 0.09 | 2.2 |
| Marine food web | Directed | 135 | 598 | 4.43 | 2.05 | 0.16 | n.a. |
| Neural | Directed | 307 | 2,359 | 7.68 | 3.97 | 0.18 | n.a. |
| Train routes | Undirected | 587 | 19,603 | 66.79 | 2.16 | n.a. | |
| Power grid | Undirected | 4,941 | 6,594 | 2.67 | 18.99 | 0.10 | n.a. |
| Internet | Undirected | 10,697 | 31,992 | 5.98 | 3.31 | 0.035 | 2.5 |
| Citation | Directed | 783,339 | 6,716,198 | 8.57 | 3.0 | ||
| Sexual contacts | Undirected | 2,810 | 3.2 | ||||
| Physics coauthorship | Undirected | 52,909 | 245,300 | 9.27 | 6.19 | 0.45 | n.a. |
| Company directors | Undirected | 7,673 | 55,392 | 14.44 | 4.60 | 0.59 | n.a. |
a Source: Newman 2003.
One way to analyze networks and their properties is by contructing them in silico. If edges are randomly added to a group of vertices, one gets a random network. With such a construction rule, the probability p that any two edges are connected increases. It turns out, upon adding edges and thus increasing p, the relative size of the largest connected (or giant) component (ngiant component/n) jumps discontinuously from small (~0) to large (~1). The network has no particular structure and its degree distribution can be approximated with a binomial distribution.
If one adds new edges with a bias, one gets a new networks. For instance, adding edges proportional to the number of edges the vertex already has, one gets a so-called scale-free network.
Efficiency and resilience
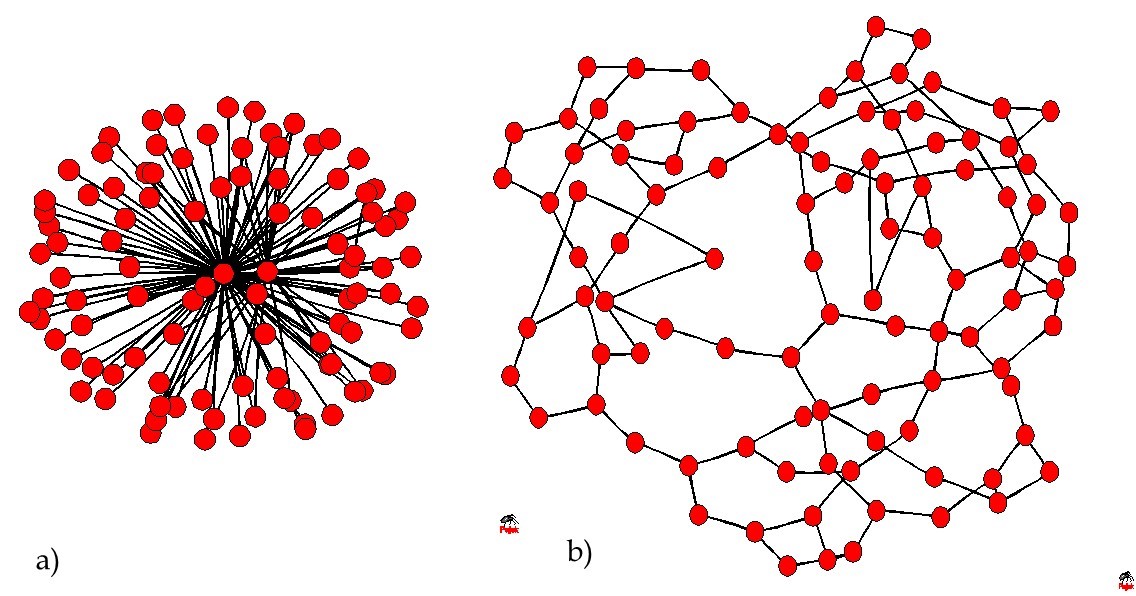
The link between efficiency and resilience can be examined with network analysis (Brede and de Vries 2009a). Mathematically, the smaller the largest eigenvalue of the adjacency matrix of the network, the more stable and thus resilient it is. Efficiency can be related to the average shortest pathlength – think of transport and communication networks. Efficient networks are star-shaped and consist of a periphery made up of a highly connected core and outward branching nodes. Resilient networks are associated with the stability around a presumed existing stationary state and have the property of redundancy. One extreme is an efficient network with a single ‘super-hub’ (Figure 1). The other extreme is a network with long loops (Figure 1b). Networks that realise a trade-off between both extremes exhibit core-periphery structures, where the average degree of core nodes decreases but core size increases as the weight is gradually shifted from a strong requirement for efficiency and limited resilience towards a smaller requirement for efficiency and a strong demand for resilience. Both efficiency and resilience are important requirements for network design and a balance between the two may be a principle of system robustness and resilience.
Figure 1. See above. Example networks. Network (a) is an extremely efficient network, (b) an extremely resilient one. Examples are all networks with 100 vertices and 250 edges (Reproduced with permission from Brede and De Vries 2009a).
Social science applications
Network theory has also been applied in the social sciences; indeed, its applications are increasing. A well-known example is the phenomenon of small worlds. In 1967, the psychologist Milgram sent out a number of packets to people who had agreed to participate in an experiment, namely that the packets had to be sent to someone in Massachusetts, but the participants were only allowed to send their packets to someone they knew by first name. It turned out that only a median of five intermediaries were needed to get the package from the participants to the person in Massachusetts. In other words: each of us is only six steps away from every other person on earth. Network theory has shown that in a network where every vertex is connected to its two neighbours, only a few additional random connections bring forth the ‘small-world phenomenon’ (Watts 1999). A few shortcuts do shrink the world dramatically. In other words, a few species or persons can make a huge difference in overall connectivity and hence function and performance of a system.
Another social science application are interpersonal networks of friendship /influence. An example is the analysis of networks of influence regarding nuclear power policy in The Netherlands (de Vries et al. 1977). The vertices are the members of governing boards, directorates and advisory councils of all the institutions (companies, ministries and councils) involved in the nuclear policy process – the stakeholders. Whenever a person has positions in two or more of these institutions, he is assumed to be a channel for the exchange of information and the exertion of influence. These ‘double-functions’ make up the network edges. The analysis revealed that only a handful of people (<20) carried a rather dense network of relationships that connected construction firms, (public) electricity generating companies, research institutions and ministries. Such organisational networks around large-scale ventures can promote effective decision making, but they also tend to exclude or ignore alternative viewpoints.
An interesting question is the role of hierarchy in networks. Intrinsic hierarchy is found in a variety of communication networks. Hierarchical networks with a modular structure are found in urban systems and organisations (Pumain 2006, 2011). Infrastructural networks with a geographic organisation, such as power grid networks and Internet router nodes, apparently do not have such a topology. In archaeology and anthropology, the observation of hierarchy in (past) human groups has been questioned (Hamilton 2020). There are reasons to assume that the ways in which human groups have organised themselves are much richer, but the ones with a high degree of centralisation and concentration may have left the most clear traces.
The sociologist Simon offers a rationale for the prevalence of hierarchical structures: ‘Complex systems will evolve from simple systems much more rapidly if there are stable intermediate forms than if there are not. The resulting complex forms in the former case will be hierarchic. We have only to turn the argument around to explain the observed predominance of hierarchies amongst the complex systems nature presents to us. Amongst possible complex forms, hierarchies are the ones that have the time to evolve’ (Simon (1969) 90–91/98–99).
Literature
Brede, M., and B. de Vries (2009a). Networks that optimize a trade-off between efficiency and dynamical resilience. Physics Letters A 373(2009)3910-3914
Buchanan, M. (2002). Nexus / Small worlds and the groundbreaking science of networks. Norton Company, New York
de Vries, B. de, K. Uitham en G.J. Zijlstra, Kernenergie in Nederland. Acta Politica 2(1977)161-206
Harari, Y. (2024). Nexus. Fern Press
Newman, M. (2003). The Structure and Function of Complex Networks. SIAM Review 45(2)167-256
Pumain, D. (Ed.) (2006). Hierarchy in Natural and Social Systems. Springer, Berlin
Watts, D. (1999). Small Worlds – The Dynamics of Networks between Order and Randomness. Princeton Studies in Complexity, Princeton University Press
Leave A Comment