One unsustainable part of the industrial economy is the mining and processing of materials and fuels which creates also large flows of ‘waste’ and burdens environmental sinks. Upstream, huge amounts of solid waste are generated in mining and processing processes. One-fifth (2%) of global energy- and process-related CO2 emissions arise from the production and processing of only five materials: steel, cement, plastic, paper and aluminium (Allwood et al. 2011). Downstream, the discarded materials and burnt fuels accumulate in landfills and air, water and soils. It has been hypothesized that the impacts may diminish as a consequence of ongoing ‘dematerialized’ economic growth. It is based on a metamodel: the Environmental Kuznets Curve (EKC).
In 1955, the economist Kuznets suggested that income inequality will initially increase with rising income per capita and then decline – another bell-shaped or inverted U-curve. The hypothesis was that political mechanisms such as voting by the poor for redistributive taxes and financial mechanisms such as credit markets could explain it. But research at the World Bank did not find evidence for a Kuznets curve in a 1960–1990 seventy-three country database. What the data do indicate is that overall economic growth coincides with growth in the income of the poorest segments of society. This is the ‘trickle-down percolator’ hypothesis, which states that economic growth will automatically benefit the poorest segment of society.
In the early 1990s, a Kuznets-type relationship was hypothesised between the per capita emission of pollutants (in t/cap/yr) and income. It is called the Environmental Kuznets Curve (EKC) hypothesis. It has been widely discussed since its proposal – see the literature list below. Early work for the World Bank Development Report in 1992 popularised the idea of an EKC to the extent that an influential economist claimed that ‘there is clear evidence that, although economic growth usually leads to environmental degradation in the early stages of the process, in the end the best – and probably the only – way to attain a decent environment in most countries is to become rich’ (Beckerman, in Stern 2004). Again, such a generalisation is not justified.
What do empirical data say? The empirical sulphur dioxide (SO2) emission intensity as a function of income for the years 1971 to 2008 seems to confirm the EKC hypothesis (Figure 1a). The early industrialised and recent industrialising regions in the world exhibit an inverted U shape. Explanations are economies of scale in abatement techniques, more strict regulation as people become more affluent and changing sector structure and trade patterns. Per capita emission in newly industrialising countries are significantly lower than for the older ones, probably because of the availability of cheap abatement technologies and less coal use.
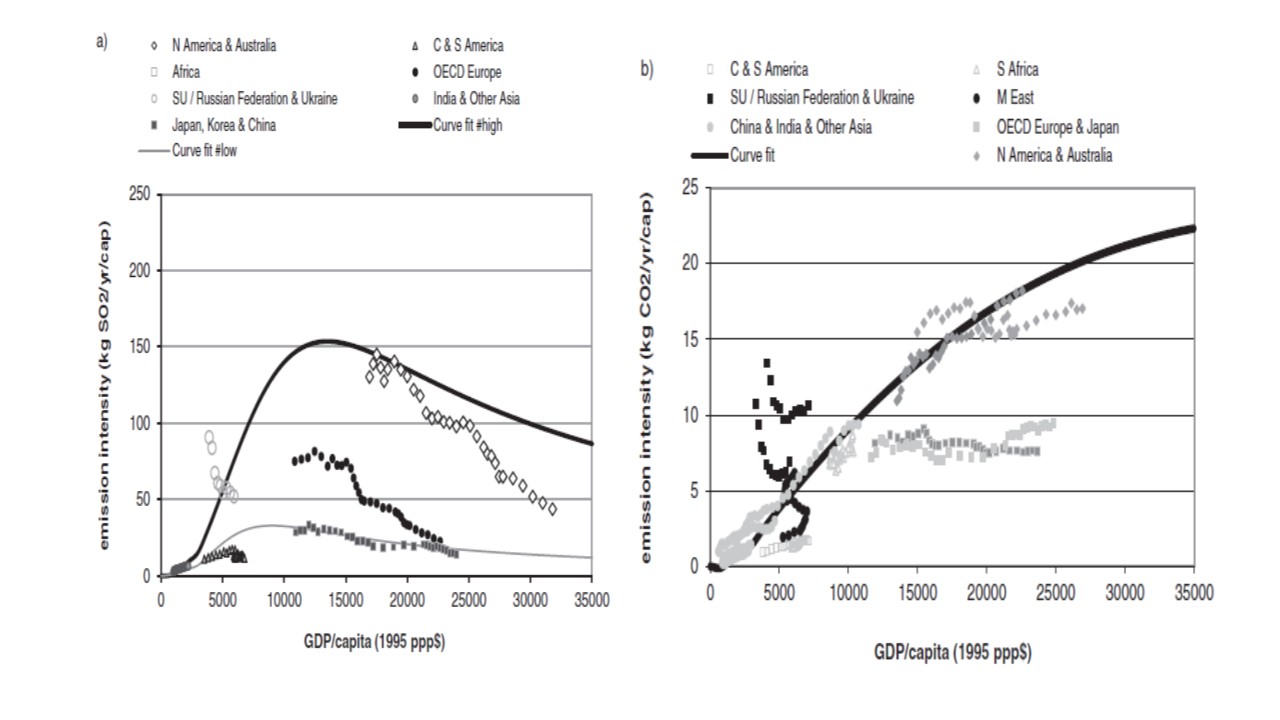
Figure 1a. The relationship between SO2 emission intensity (t/cap/yr) and income (GDP/cap) for some regions in the period 1971–2008. The dots indicate the empirical SO2 emission intensity (t/cap/1995$) and the solid line is a possible curve fit (source of data: PBL).
For CO2, the curve does slope downwards, but there is as yet no maximum (De Vries 2013). One explanation is that CO2 emissions are from essential and rather dispersed sources; another one is that international competition initiates a race to the bottom in emission standards that obstructs or at least postpones the decline phase. For both SO2 and CO2 emissions, there is a large spread in the data and, again, a significant difference between North America and Australia on the one hand and the more densely populated Europe and Japan on the other.
Evidently, the validity of the EKC hypothesis depends on the definition and type of pollutants and on the specification of causes. It has some validity in specified places and periods. The level and organization of the economy and the area, the type of pollutant and the time-period considered all matter. “Only air quality indicators, especially local pollutants, show the evidence of an EKC.” (Dinda 2004). Using urban pollutant concentration data, for instance, leads to a different conclusion than using national SO2 and CO2 emission data. For most new chemicals released on the market, the per capita emission probably increases with higher income.
Several researchers have investigated the EKC hypothesis in an econometrically rigorous way and some find the methods invalid and the evidence spurious (Wagner 2008). Overall, ‘the majority of studies have found the EKC to be a fragile model suffering from severe econometric misspecification . . . it seems unlikely that the EKC is an adequate model of emissions or concentrations’ (Stern 2004).
The EKC hypothesis may be an aggregate feature of advancing economies, but in low-income countries one may expect an opposite or delayed trend due to technological, economic and social delays. Moreover, the trend in low-income regions is affected by transfer of polluting activity from rich to poor countries. Probably, convergence will happen over longer time-scales, but before then irreversible environmental damage may have occurred.
For a deeper understanding of mechanisms and policies, one has to broaden the scope towards the material and energy transition, with an explicit consideration of use efficiency, substitution and reuse and recycling. Then the question returns: what actually are the environmental impacts and what is the resulting damage to human and ecosystem health?
From an epistemological viewpoint, a metamodel exemplified by a possible correlation between economic and environmental variables faces the risk of misunderstanding and/or abuse. In particular, statements of high aggregation level can easily be used to defend a particular worldview or be in such blatant contradiction with a person’s local experience that it is simply dismissed.
Literature on EKC (chronological)
Bernardini and Galli (1993). Dematerialization: long-term trends in the intensity of use of materials and energy. Futures 1993:431-448
Stern, D., M. Common and E. Barbier (1996), Economic growth and environmental degradation: the Environmental Kuznets Curve and sustainable development, World Development 24 (1996)1151–116
Bruyn, S. de, J. van den Bergh and J. Opschoor (1998). Economic growth and emissjons: reconsidering the empirical basis of environmental Kuznets curves. Ecological Economics 25(1998)161-175
Munasinghe, M. (1998). Is environmental degradation an inevitable consequence of economic growth: tunneling through the environmental Kuznets curve. Ecological Economics 29(1999)89-100
Galeotti, M., and A. Lanza (1999). Richer and cleaner? A study on carbon dioxide emissions in developing countries. Energy Policy 27(1999)565-573
Fischer-Kowalski, M. and C. Amann (2001). Beyond IPAT and Kuznets Curves: Globalisation as a Vital Factor in Analysing the Environmental Impact of Socio-Economic Metabolism. Population and Environment 23(2001)1
Spangenberg, J. (2001). The Environmental Kuznets Curve: A Methodological Artefact? Population and Environment 23(2001)2
Lindmark, M. (2004). Patterns of historical CO2 intensity transitions among high and low income countries. Explorations in Economic History 41(2004)426-447
Stern D. (2004) The rise and fall of the environmental Kuznets curve, World Development 32(2004)1419-1439
Dinda, S. (2004). Environmental Kuznets Curve Hypothesis: A Survey. Ecological Economics 49(2004)431-455
Galeotti, M., and A. Lanza (2005). Desperately seeking environmental Kuznets. Environmental Modelling & Software 20(2005)1379-1388
Focacci, F. (2005). Empirical analysis of the environmental and energy policies in some developing countries. Energy Policy 33(2005)543-554
Churchill, S., J. Inekwe, K. Ivanovski and R. Smyth (2018). The Environmental Kuznets Curve in the OECD: 1870–2014. Energy Economics 75(2018)389-399
Luzzati, T., M. Orsini and G. Gucciardi (2018). A multiscale reassessment of the Environmental Kuznets Curve for energy and CO2 emissions. Energy Policy 122 (2018) 612–621
Leave A Comment