Models of oil and gas exploitation
An important issue in sustainable development discourses is the depletion of finite resources of fossil fuels and minerals. The concepts of supply cost curves and reserve-production ratios (RPR) have been introduced in resource economics, in combination with learning-by-doing (see Appendix 8A.1 en Box 17.2 in Sustainability Science book and the blog Energy Economics).
Usually, the emphasis is on the key question: how big is the resource or, in expert jargon, what is the geological resource base? For mineral ores, solid evidence on resource ore quantity and quality is limited by its very nature to those regions that have been explored. However, it is possible to infer more speculative occurrences with hypotheses about how ores have formed in geological time. In 1954, the geologist Ahrens proposed a ‘fundamental law of geochemistry’, which has become known as the crustal abundance geostatistical (CAG) model (https://www.sustainabilityscience.eu/crustal-abundance-resource-model/).
Oil in the USA: the logistic growth model
For fossil fuels, another model has become well-known: the logistic growth life cycle model. It was first stated in 1956 by the American geologist King Hubbert and is based on the exploration and exploitation history of a region and has been applied mostly for conventional crude oil and natural gas. Using past oil exploration and exploitation statistics for the United States (48) (onshore and offshore of the lower 48 states without Alaska), King Hubbert found that the discovery rate per $ spent on exploration declined and forecasted that output in the United States (48) would peak around 1970. Since then, United States (48) conventional oil production has declined within 5% of this prediction. The discovery and subsequent exploitation of huge oil fields in Alaska retarded the decline for a few years. But since 1986, the decline has continued and the United States has become ever more dependent on imports – from Canada and Mexico, amongst others. Accumulated conventional oil output in the United States can accurately be simulated with a logistic trajectory, with minor deviations during the period of the oil crises and high oil prices of the 1970s and 1980s (Figure 1). There is a delay of only ten years between accumulated production with and without reserve, which means the reserves have always been equal to about ten years of production.
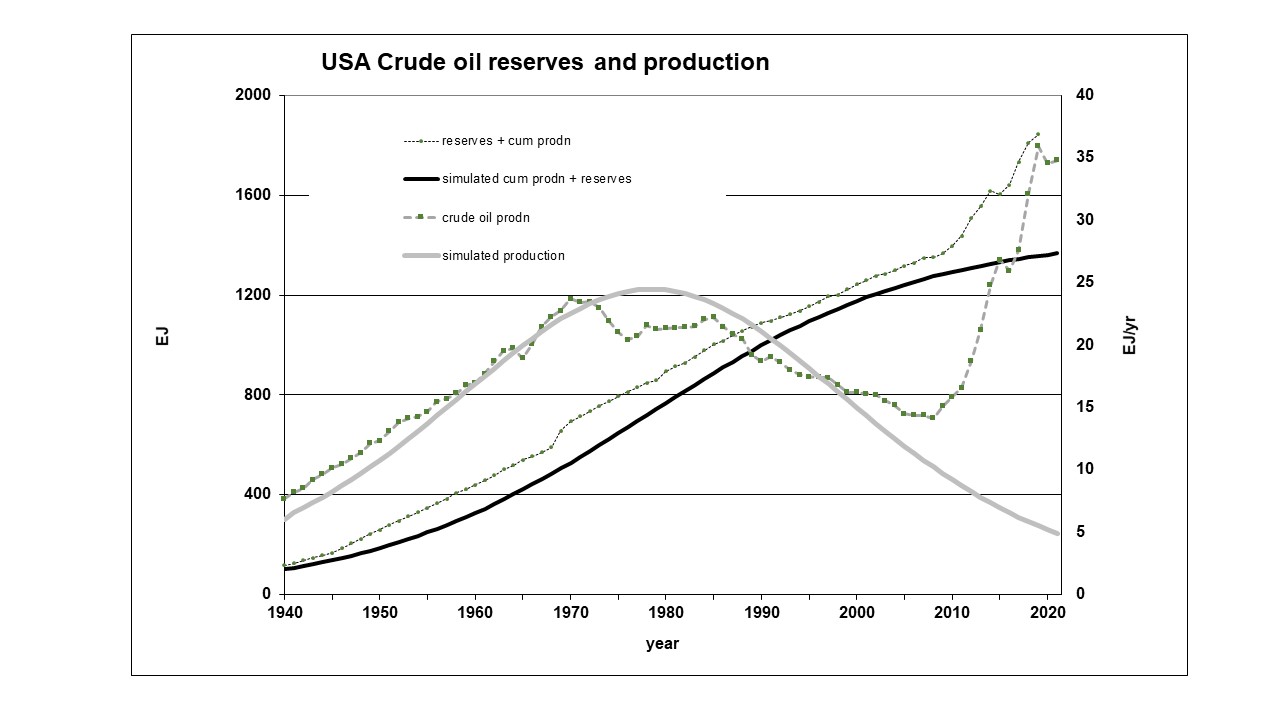
Figure 1 Oil accumulated production, reserves and annual production rates for the United States (source of data: TEPD 2010, www.bp.com).
In retrospect, King Hubbert’s prediction looks surprisingly correct until 2010, and the model seems a useful metamodel. The explanation of the peak is not necessarily a geological constraint due to depletion. It may also reflect the strategy of U.S. oil companies to look abroad for cheaper crude oil supplies and to import oil and oil products. For instance, in the Cold War era, the U.S. government restricted for military reasons oil imports to less than 10 percent of oil use, which led to a relatively deep depletion of U.S. resources and a cheap Middle East oil glut in Europe (Yergin 1991). However, the model breaks down after 2010 when reserves and production suddenly jump upwards towards levels above 20th century levels. The reason? Exploitation of so-called tight oil with the use of fracking technologies. They create new environmental problems and resource cascades (https://www.sustainabilityscience.eu/guar-gum-indian-farmers-and-usa-gas-fracking/).
Yet, data on fossil fuel reserves and production for a couple of countries show clear signs of the occurrence of a life cycle profile in reserve and production. For instance, production since 2000 in four countries outside the Middle East (Mexico, Indonesia, United Kingdom and Norway) is probably past their peak and can only be maintained at a relatively low level by developing more costly occurrences at greater distance and/or depth. At the same time, new finds in other countries like Surinam and Angola are eagerly exploited to boost the local economy and elites, often through exports. These, too, face rapid depletion with the usual exploitation practices in place. For all these countries, a decline in production and reserves poses on the one hand serious challenges for economic development, depletion forcing them to search alternatives in a rather short time, and is on the other hand a necessary part of the larger, global shift away from fossil fuels in order to comply with climate change related reduction in carbon emissions.
Natural gas in the Netherlands
In principle, the logistic model is also valid for natural gas. Indeed, it used to be the standard way of looking at future supply, as was shown for the gas fields in the North Sea. Empirical data for reserves and production of natural gas in The Netherlands, however, deviate even in the short run significantly from a logistic growth path (Figure 3). Initially, The fast upward appreciation of the gas reserve in the giant Groningen field in the 1960s led to a steep increase in estimated reserves and exploitation quickly followed exploration because everyone was to gain: industry and households rapidly switched to this more convenient and cheap fuel, Shell and Exxon earned huge profits and the state got a fast rising source of income (causing the ‘Dutch disease’). However, the oil crises in the 1970s and 1980s made it clear that this natural gas was actually a precious resource, which was used inefficiently: Dutch houses had among the worst insulated in Western Europe and gas-fired electric power plants operated far below the prevailing combined-cycle potential. The production profile therefore started to level off. Then, in the 1990s, concerns about climate change due to rising greenhousegas concentrations intensified research and implementation of energy efficiency and (prospects for) renewable energy like wind turbines and solar photovoltaïc (PV) panels. Despite the relatively low carbon-emission of natural gas, it was another counterforce to larger production. Around 2005, it became clear that the exploitation of the huge Groningen field caused an increasing number of earthquakes with corresponding damage and protests. This led after much political turmoil in 2020 to the decision to stop production from the Groningen field, which is seen in Figure 3 upper right curve. This history shows the importance of local-regional rules and practices and of contingent events.
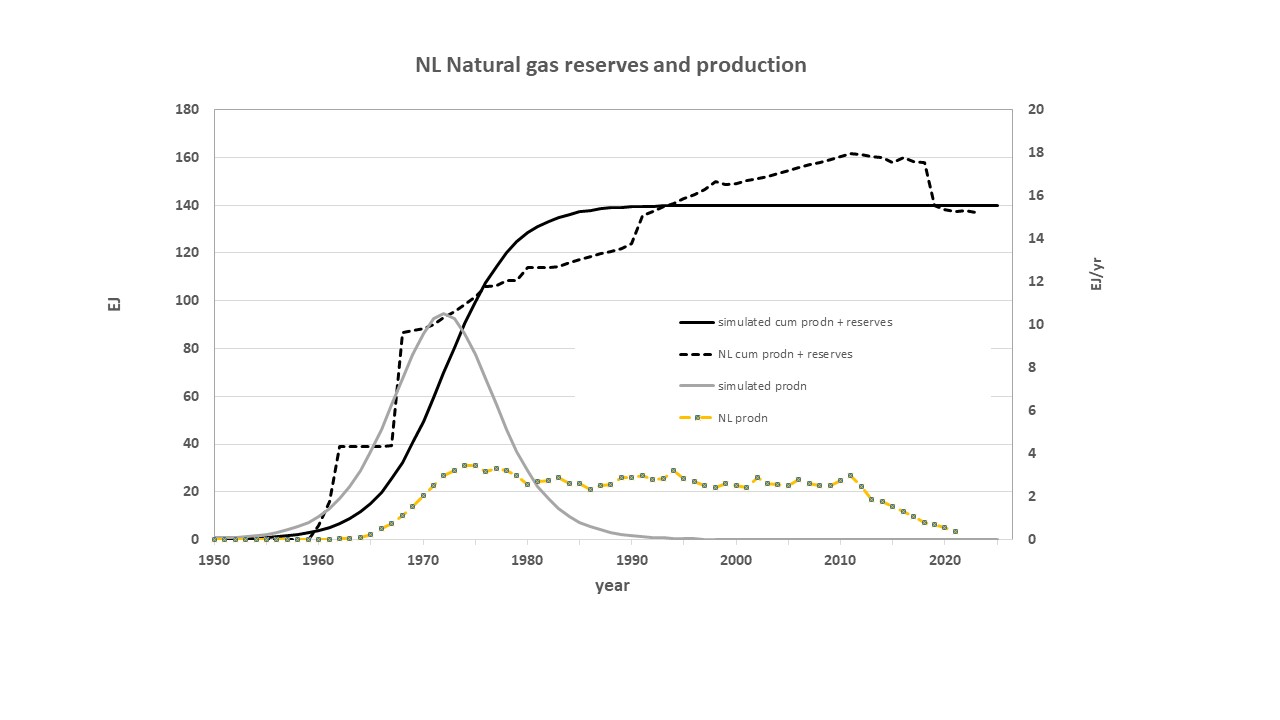
Figure 2 Natural gas accumulated production, reserves and annual production rates for The Netherlands and some other countries (source of data: BP and Ministry of Economic Affairs).
Leave A Comment