The important problem of steady state would not be production but distribution. You can no longer avoid the problem of relative distribution by resorting to growth. (Herman Daly, personal communication)
What is the essence of the neoclassical growth model? What is the role of technology? And what is needed to make macro-economic (growth) theory relevant in the 21st century?
The economic system
Real-world economic (growth) dynamics is far too complex to conceptualise in a single scheme. Nevertheless, following the system dynamics approach, I offer an integrating causal loop diagram (CLD) of basic mechanisms in (capitalist) economies (Figure 1).
I distinguish three subsystems: consumer behaviour, entrepreneurial investments and innovation. The consumer side, in the upper part of the CLD, is a reinforcing feedback representation of a complex process that revolves around the individual needs, wants and desires for positive experiences. In agreement with psychological research, the level of happiness/contentment is influenced by processes of comparison, competition, repetition and habituation. This is indicated with two negative feedbacks. The fulfillment of needs, wants and desires is satisfied with help of private and public goods or satisfiers and capabilities. The capabilities are supplied in the form of public (infrastructure, education or health) and private goods. Taxation is one of the main mechanisms to finance public goods.
The goods and services that provide the satisfiers and capabilities have to be produced. This is represented with another feedback loop, in the lower right of the CLD. In essence, demand leads to investments from which costs and prices follow. The underlying mechanisms are complex market and institutional processes, but the widely shared assumption is that lower prices will lead to higher sales in the longer run in competitive markets. The dominant force, however, is technology. It is represented in the feedback loop in the lower left of the CLD. Savings and profits provide capital for expansion and replacement investments, but also for R&D and innovation. In combination with capital-labour substitution and economies of scale/scope, it leads to higher labour productivity. This increases income and tends to decrease unit costs. In this way, technology drives the larger, positive feedback process of economic growth. It also satisfies the desire for new products that is a consequence of the repetition/habituation process amongst consumers and is stimulated by advertisements.
Figure 1 is an extended version of the standard flow diagram of economic textbooks. Transactions between producers and consumers are at the center of the (market) economy. Governments and banks are two other important subsystems. In the core part of the industrial economy, labour and capital are the production factors and the rewards (wages and dividends) are used for consumer expenditures. Money is the numéraire in this system. The monetary flows are attached and add value to the underlying physical stocks and flows. Besides, there are large information flows to facilitate transactions between producers and consumers and between entrepreneurs, labourers, governments and bankers.
Most economic activities, regulations and data are defined at the level of the ‘sovereign’ states, that are mutually linked through exchanges of goods and services, information and people. Not all human activities are registered as part of the formal economy. The monetary economy is continuously, and in manifold ways, interacting with people living in subsistence and informal economic systems. Both formal and informal economy are embedded in the larger life support system (§10.4). In a sustainability context, it is important to have this more inclusive perspective on ‘the economy’.
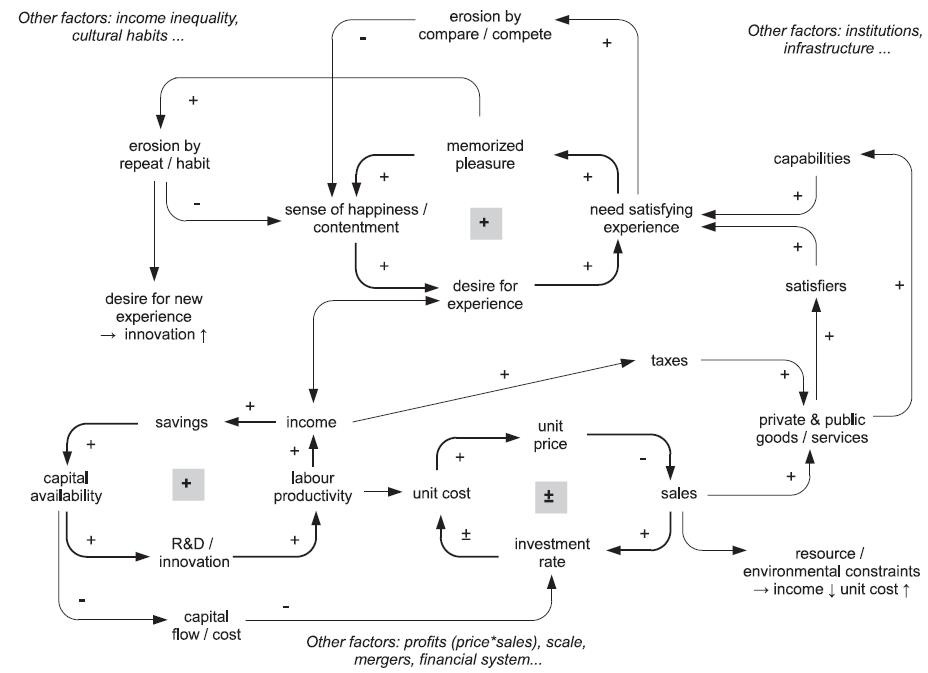
Figure 1. A simplified causal loop diagram representation of the economic system. It portraits three subsystems: the consumer side (above), the producer side (lower right) and the capital and technology side (lower left).
The neoclassical growth model
It was long known that the use of tools and machines make human labourers more productive. It was formalised by Solow (1957) in the neoclassical model of economic growth, in which capital accumulation plays a central role. Capital K and labour L are the production factors. Land and resources, including fossil fuels, were initially left out because of their small and declining role. The increase in the capital-labour ratio allows output per worker, that is, labour productivity, to increase.[1] Because it implies that the same output can be produced with less labourers, the process is referred to as capital-labour substitution because workers are replaced by machinery. The capital stock K is built up from investments I. It wears out and is taken out of production and depreciates at a presumedly fixed rate m.[2] Thus:
![]() (eqn. 1)
(eqn. 1)
In simulation models, the equation is treated as a discrete equation, but in its derivations, it is usually expressed as a differential equation. The equation describes a pseudo-dynamic process, during which the system jumps from one equilibrium state to the next. If the population increases at rate n and the fraction of workers in the population remains constant, the growth of the labour force is given by dL/dt = nL. Using the macroeconomic bookkeeping identity that output Y equals the sum of consumption C and investment I and normalising variables with respect to L, equation 1 becomes:
![]() (eqn. 2)
(eqn. 2)
with y = Y/L output per worker and k = K/L capital per worker. This equation states that the stock of capital per worker equals the per worker investments minus the per worker capital depreciation and the dilution from population growth.
You can specify the model if you postulate a production function Y = Y(K,L) that represents all the possible combinations of production factors {K,L} that produce a certain output Y.[3] Following the aggregate trends in both agricultural and industrial economies, the production function is assumed to exhibit constant returns to scale and diminishing returns.[4] Using these properties and assuming that the production function is normalised (Y0 = 1, K0 = 1, L0 = 1 at time t = 0), a suitable production function is of the form:
![]() (eqn. 3)
(eqn. 3)
or normalised with respect to L:
![]() (eqn. 4)
(eqn. 4)
This is the widely used formulation proposed in the 1920s by Cobb and Douglas (CD). It states that a rising capital-labour ratio k increases labour productivity y but with diminishing returns and with constant returns to scale. Inserting equation 14.4b into equation 14.3 gives:
![]() (eqn. 5)
(eqn. 5)
This is the basic equation of the neoclassical growth model (Barro and Sala-i-Martin 2004). For dk/dt = 0, there is a steady-state {c*,k*} at which per worker consumption level c* is given by:
![]() (eqn. 6)
(eqn. 6)
at the capital-labour ratio k*. Equation 6 is graphically shown in Figure 2 with the curves for kα and (m + n)k as a function of the capital-labour ratio k. For c < c* the economy will grow towards higher k-values.
Is there any empirical confirmation? By way of example, I inserted in Figure 2 the empirical data for agriculture in Belgium for the period 1880–1989 (Swinnen et al. 2001). Between 1880 and 1930, the capital-labour ratio k fluctuated between 0.46 and 0.54, and there was no substitution and no productivity increase. After World War II, the k-value started to increase rapidly and these data can be reproduced with a CD production function. It suggests a growth path towards a steady-state, but in reality, the k-value dropped significantly in the 1980s. Even in the relatively simple agricultural sector, other mechanisms than factor substitution were operating, such as innovation waves, international trade, government interference on behalf of consumers or farmers and the possibility of capital-land substitution and capital-labour complementarity in poor countries (Haley 1991).
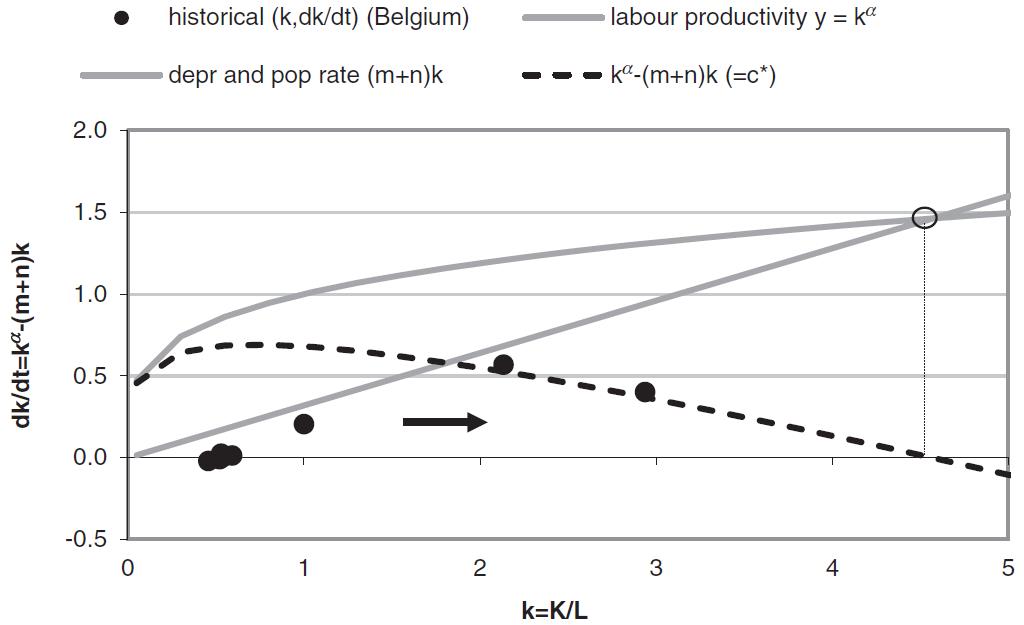
Figure 2. The neo-classical economic growth model. Labour productivity y increases in proportion to kα (upper grey curve). Output partly goes to capital depreciation (mk) and to population growth (nk). The difference is available for per capita consumption c (dashed black curve). The steady-state levels k* and c* are at the intersection of the two curves (open dot). (alpha = 0.35; m = 25%/5 yr; n = 7%/5 yr). The black dots indicate estimated values for Belgian agriculture 1880–1980 (source of data: Swinnen et al. 2001).
From a sustainable development perspective, the neoclassical growth model suggests the best of possible worlds and a recipe for sustainable development. It predicts that per capita income levels can exceed subsistence levels permanently through capital accumulation, that is, rising k, in contrast to Malthus’ conviction. It indicates that an economy has a natural tendency to reach a zero-growth steady-state and that per capita income differences between countries have a natural tendency to disappear.[5] Unfortunately, even apart from resource and environment constraints, the real world behaves differently. Capital accumulation and capital-labour substitution undoubtedly played an important role in economic growth. But time-series and cross-country analyses of economic growth in industrial economies during the 20th century show that they explain only half or less of the observed output growth and that no income convergence amongst the countries of the world takes place except in a few ‘convergence clubs’. These shortcomings in the theory have been acknowledged since the 1980s (Barro and Sala-i-Martin 2004; Helpman 2004).
One reason of failure is the high aggregation level of description, interpretation and measurement of the production factors. Labour reflects a wide variety in skill and age levels. In advanced economies, fossil fuel is almost completely substituting for physical labour and most labour is involved in control and information. Economists have introduced the notion of human capital in order to incorporate the differences and changes in skill levels with proxies, such as number of years of schooling. It provides some additional explanation (Helpman 2004). Capital also represents a variety of items and undergoes quantitative and qualitative change. Table 14.1 shows data for the capital stocks in four countries as quantified in monetary units by the national statistical offices. Per person capital stocks have roughly linearly increased over the last decades in these countries.[6] The data indicate that in the order of two-thirds of the capital stock consists of dwellings, buildings and infrastructure and that the structural composition in monetary terms changes only slowly. But scale effects, factor returns and capital-labour substitution for dwellings, buildings and infrastructure are different from those in sectors such as information and communication technology (ICT). Indeed, this is one reason to use the simpler production function: Y = AK, introduced by Leontief. Defining the savings rate σ = I/Y and replacing kα –c with σ Ak in equation 7, the growth equation becomes:
![]() (eqn. 7)
(eqn. 7)
Assuming a closed economy in which the savings rate is constant and equal to the investment rate, this model stipulates a continuous exponential growth in output as well as in capital stock and consumption. Although this is the historical experience in certain periods and places, it lacks explanatory power. Already a century ago, economists turned to another determinant of growth: the knowledge incorporated in capital and labour or, in short, technology.
| Table 1. Structure of capital stocks in Switzerland (2006), Finland (2006) and Australia (1993–1994)a | ||||||
| Switzerland 2006 | % | Finland 2006 | % | Australia 1993–1994 | % | |
| Construction | Building | 55.8 | Residential buildings | 40.0 | Private | |
| Civil engineering | 15.2 | Non-residential buildings | 26.7 | Dwellings | 32.5 | |
| As part of construction: Machinery and equipment | 27.6 | Other structures | 12.6 | Construction | 17.2 | |
| Fabricated metal products and machinery | 14.4 | Other machinery and equipment | 15 | Equipment | 15.5 | |
| Office machinery and computers | 1.2 | Public | ||||
| Electrical machinery and apparatus n.e.c. | 2.3 | Dwellings | 1.9 | |||
| T.V., radio and communication equipment and apparatus | 2.1 | Construction | 23.6 | |||
| Medical, precision and optical instruments, watches and clocks | 3.8 | Transport equipment | 3.1 | Equipment | 4.8 | |
| Motor vehicles, trailers and semi-trailers | 0.8 | |||||
| Other transport equipment | 2.9 | |||||
| Cultivated assets | 0.2 | Major improvements to land and so on | 1.1 | |||
| Computer and related services | 1.3 | Software, knowledge, entertainment, art and so on | 1.5 | |||
a Sources: www.rba.gov.au/statistics/op8_index.html,
www.bfs.admin.ch/bfs/portal/en/index/themen/04/02/04/key/Stock cap.html and www.stat.fi/til/pka/tau en.html.
It is worthwhile to note that the neoclassical growth model in itself tends towards a steady-state, with declining marginal capital productivity. Other factors are responsible for most of economic growth, measured as GDP-growth. First and foremost is science-based innovation, in the form of new technology incorporated in capital goods and in labour skills to operate them. Secondly, the role of the financial system has become so important that it can no longer be treated as simply one of the economic sectors. Relatedly money can no longer be seen as ‘neutral’. Thirdly, the transition to a great variety of service- and information-driven economic activity introduces new mechanisms and accounting issues. Finally, and prhaps in a negative way, environmental feedbacks will start to play a large(r) role and affect (disposable) income (growth).
The role of technology
The first and simplest way to include technology in the production function is with an exogenous factor, for instance:
![]() (eqn. 8a)
(eqn. 8a)
The term A is called the total factor productivity (TFP) and can, not surprisingly, explain a large part of productivity growth.[7] ‘Technology’ becomes an all-explaining deus ex machine, a manna from heaven. One way to estimate A is through the idea of learning-by-doing, that expresses A explicitly as a function g of accumulated knowledge by workers (equation 9):
 (eqn. 8b)
Often, an S-shaped curve is assumed for g, with the argument that, within a certain regime, additional output no longer generates any productivity increase when the niche is filled (§13.3). Assuming a CD production function, the new formalism implies again a path towards a steady-state. Another way to endogenise technology is to emphasise the knowledge of workers and introduce human capital as a production factor: H = Lh. The variable h is a measure of the quality of the worker that can be estimated from education levels, amongst others (Barro and Sala-i-Martin 2004, Weber et al. 2005).
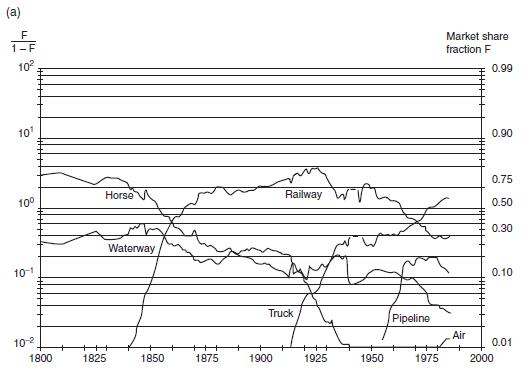
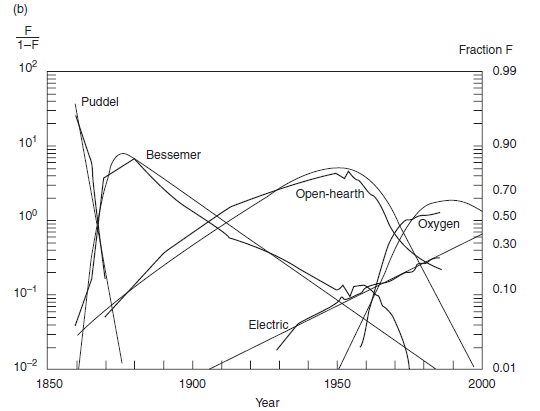
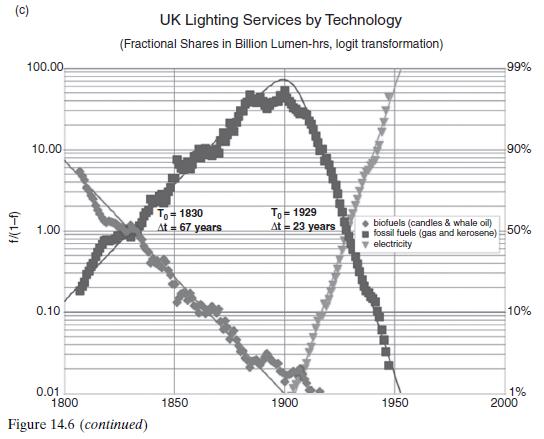
Figure 3a,b,c. (a) Logistic substitution in transport modes in France since 1800, (b) in global steel manufacturing process technologies since 1850 (c) and in lighting technology (Source: Grübler 1999, www.iiasa.ac.at).
At least three more mechanisms link technology to output: factor price–induced innovation., R&D investments and (see section 19.2.3). More in-depth insights into the mechanisms of economic growth come from innovation theory and business dynamics (§10.4). Since the 1980s, some economists have more radically incorporated the role of science and technology and of human behaviour in economic theory and models. Building on earlier work by Veblen, Schumpeter, Simon and others, Nelson and Winter laid the foundation of evolutionary economics in their book An Evolutionary Theory of Economic Change (1982). The Homo economicus is replaced by a pragmatic and adaptive individual or organisation, who is imperfectly informed, operates with bounded rationality and learns from previous experiences.[8] On the basis of reproduction, selection and mutation processes, agents choose or imitate strategies that are more rewarding and successful vis-à-vis their objective. The evolutionary mechanism of survival under selection pressure is thus central in these models (van den Bergh et al. 2007). It has the strength of the biosciences but creates a ‘bottom-up’ bias that tends to neglect or deny the ‘top-down’ coordination and regulation mechanisms (§10.5).
Evolutionary economists attempt to simulate two major groups of actors in an economy: producers and consumers.[9] A small group of agents (producers and consumers) ‘drive’ the system to more and novel products for consumption, exploiting the desire for profit, status and novelty. Technological change is incorporated in the investment decisions of the producers. If it is completely absent, the model economy is in a steady-state with zero growth. When it is turned on, the model economy starts to evolve in a permanent disequilibrium. Although the vocabulary of evolutionary economists is different, several model features (such as desired or anticipated versus actual values) resemble elements of the system dynamics models – and, not surprisingly, so do the conclusions.
System dynamic models of economic growth address some of the shortcomings in economic theory by introducing agents (mechanisms) that have local information about profitable opportunities for change but proceed, in the absence of global information about the (future) system, incrementally in a direction that improves the profit or another target or performance indicator (Sterman 2000). Change happens in incremental steps, in a gradient-following process. The engine of economic growth is conceived of a series of connected feedbacks, or increasing returns in economist terminology. Important ones at the level of corporations are:
- unit production cost: there is continuous drive to lower unit cost through R&D (§11.6). Traditionally, the ways to reduce costs are through economies of scale, economies of scope and learning-by-doing. All three can work as positive feedback loops through which unit cost declines;
- unit development cost: in many modern knowledge-intensive industries, the upfront development costs, are a large fraction of total cost and the actual production cost are small or negligible (chips, software or music as examples). Once underway, there is an enormous drive to create large sales to recover the upfront cost;
- product awareness: firms will use advertising and sales efforts to promote their In combination with word of mouth and media attention, this may create a positive feedback towards ever larger sales and market share.
New product development, acquiring mono- or oligopolistic market power, mergers and acquisitions, promoting workforce quality and loyalty, and access to cheap capital by high profits and growth rates are other elements in the battle for growth of firms and corporations. A particularly important mechanism is the positive feedback from interaction synergies and network effects, with significant path dependencies (§10.5).
Economic theory is in crisis, as became manifest in the events of the last decades. This is largely the result of the dynamic processes in capitalism, in particular technological changes, globalization and financialization. How can it develop into a more meaningful theory for the 21st century?
The difficulty lies not with the new ideas, but in escaping the old ones. (John Maynard Keynes 1936)
The crisis consists precisely in the fact that the old is dying and the new cannot be born. (Gramsci 1971).
Elements of a new macro-economic theory
Changes in factor abundance
The mainstream economic (growth) model focuses primarily on (physical) capital and (wage) labour as production factors. However, whereas in the 19th and 20th century ‘nature’, notably land and resources, was relatively abundant and (financial) capital was scarce, this has reversed in the 21st century. There is an abundance of financial capital, which seeks for profit in a world of increasing scarcity of ‘nature’ in a broad sense (sources and sinks). Besides, labour has also become relatively abundant with increasing and ongoing mechanization, automation and computerization. It asks for new conceptual frameworks. Essential features in industrial capitalism: the formation of labour and land markets (Polanyi 1947) and the omission of physical and geopolitical resource scarcity, have to be revisited. An example is the comprehensive, critical but accessible guide to the role of land in housing policy and how it has been excluded from mainstream economic theory (Ryan-Collins et al. 2017).
Since the 1970s, many attempts have been made to include ‘the environment’, in the broad sense of resources and sinks, explicitly into economic growth models. I refer to textbooks on ecological and environmental economics. It has given a wealth of insights, such as a relationship with the Environmental Kuznets Curve (EKC) hypothesis (Brock and Scott Taylor 2010) and the great dilemma’s of using discounting (time preference) of the future. The latter os prominent in the ongoing debate about the ‘costs and benefits’ of climate policies, when discount rates are used to evaluate uncertain very large risks in a distant future.
Dynamic instead of pseudo-dynamic
The analytical growth models discussed so far are pseudo-static in the sense that the economic system is assumed to reach an internal price-volume equilibrium at any moment considered. ‘[Equilibrium thinking has] so permeated economics that very few attempts have been made . . . to develop theories in which the existence of cycles is an integral feature of the economy’ (Ormerod 1998). Real-world supply- demand mismatches are probably endogenous and can significantly influence the economic and financial system, but they are absent in economic growth models.
Non-equilibrium has entered economic theory and modelling in a number of ways. Perhaps best known is the introduction of expecations of the ecnomic agents, which are a crucial element in Keynesian theory and in the appearance of boom-bust cycles (Minsky 1989). Another example is the explicit formulation of supply-demand mismatches and, with a delay, price-based corrective incentives (Hallegatte et al. 2009). It has methodologically been worked out by Godley and Lavoire (2007).
The financial system
See https://www.sustainabilityscience.eu/the-financial-system/
Pluralism
There have always been divergent perspectives on what matters in economic science: the representation of agents, the role of values and ethics, the dynamics of markets and the intervention of the state etc. Without going into detail, the list of references below includes some of the books which highlight such other perspectives outside of the mainstream neoclassical economics taught in most schools and universities. One of these is The values of economics – An Aristotelian perspective by Van Staveren and is discussed on this site at www.sustainabiltyscience.eu .
Literature
Akerlof, G., and R. Shiller (2009). Animal Spirits – How Human Psychology Drives the Economy, and Why It Matters for Global Capitalism. Princeton University Press, Princeton
Arthur, W (1990). Positive Feedbacks in the Economy. Scientific American 2(1990)80-85
Barro, R., and X. Sala-i-Martin (2004). Economic Growth. MIT Press, Cambridge, Mass. (2nd ed.)
Brock, W., and M. Scott Taylor (2010). The Green Solow Model. Journal of Economic Growth 15(2010)127-153
Chang, H. (2010). 23 Things they don’t tell you about capitalism. Penguin Books, London
Daly, H. (1977). Steady-state Economics: the economics of biophysical equilibrium and moral growth. W. H. Freeman, San Fransisco
Dasgupta, P. (2007). Economics – A Very Short Introduction. Oxford University Press
Döpfer, K. (Ed.) (2005). The Evolutionary Foundations of Economics. Cambridge University Press, Cambridge
Galor, O., and D. Weil (2000). Population, Technology, and Growth: From Malthusian Stagnation to the Demographic Transition and beyond. The American Economic Review, 90(4)806-828
Godley, W and M. Lavoie (2007). Monetary economics : an integrated approach to credit, money, income, production and wealth. Palgrave Macmillan, Basingstoke, UK.
Helpman, E. (2004). The Mystery of Economic Growth. Harvard University Press, Boston
Madsen, J., J. Ang and R. Banerjee (2010). Four centuries of British economic growth: the roles of technology and population. Journal of Economic Growth 15(2010)263–290
Nelson, R., and S. Winter (1982). An Evolutionary Theory of Economic Change. Cambridge, Mass., Harvard University Press.
Ormerod, P. (1998). The Butterfly Economy: A New General Theory of Social and Economic Behavior. Basic Books, London
Ryan-Collins, J., T. Lloyd and L. Macfarlane (2017). . New Economics Foundation
Samuelson, P. (1947/76). Foundations of economic analysis. Atheneum, New York (8th ed.)
Staveren, I. van (2001). The values of economics – An Aristotelian perspective. Routledge, London and New York
Sterman, J. (2000). Business Dynamics – Systems Thinking and Modeling for a Complex World. Boston, Irwin McGraw-Hill
Tylecote, A. (1992). The long wave in the world economy – The present crisis in historical perspective. London, Routledge
Vries, B. de (2010). Interacting with complex systems: models and games for a sustainable economy. PBL Background Studies Report number 550033003 (www.globalsystemdynamics.eu; www.pbl.nl)
White, M., and I. van Staveren (2010). Ethics and Economics – New Perspectives. Routledge
Zeckhauser, R., and W. Viscusi (2008). Discounting dilemmas: Editors’ introduction. Journal of Risk and Uncertainty 37(2008)95-106
See the ARTE documentary DO WE NEED ECONOMIC GROWTH? at https://www.youtube.com/watch?v=Akr3OKUf6Uw or https://www.arte.tv/en/videos/104840-007-A/42-the-answer-to-almost-everything/
Footnotes
[1] The production factors capital K and labour L can be expressed per unit output. It is called the factor intensity. The inverse is called the factor productivity and tells how much output is produced per unit of factor input. More specifically, the output per unit of labour is called labour productivity and indicated with a small letter: y = Y/L.
[2] The depreciation rate is often approximated with 1/L with L the economic lifetime of the capital stock (Chapter 2). I suppress the index t (time) in this and subsequent equations. The assumption is that the period Δt is long enough to let the system come into equilibrium – usually one year.
[3] Normally, only the input combinations that give the highest possible output are considered. In that sense, it represents a production frontier and the best available technology. Real-world performance will be lower. According to economists, this justifies the assumption of perfect rationality in human behaviour: The models do not claim perfectly rational behaviour of real-world persons but, rather, explore the conditions and outcomes if such behaviour were to happen.
[4] Constant returns to scale is the property that total output increases with a factor n if all inputs increase with a factor n: Y(nK, nL) = nY(K,L). If it is less (more), there are decreasing (increasing) returns to scale. This assumption is shown to be invalid in the service and information economy (Appendix 10.1). A production function exhibits decreasing or diminishing returns if doubling of one of the inputs gives less than a doubling in output. It is effectively equal to a stabilising feedback. The opposite of a positive feedback is referred to as increasing returns.
[5] The growth rate is lower for higher capital-labour ratio’s, so poor countries with low capital per worker levels can grow fast and eventually converge with the rich countries at high k-levels (convergence).
[6] The increase in k, that is, in capital per worker, is probably lower in these economies because the labour force grew faster than the population. This has partly been compensated by less working hours (Chapter 4).
[7] For instance, in OECD countries, 16 to 47 percent of GDP growth in the period 1960–1995 is not explained by contributions from capital and labour (Barrro and Sala-i-Martin 2005).
[8] In the process, the 19th-century metaphors of classical thermodynamics and mechanics are replaced by another set of – also 19th-century – metaphors from Darwinian biology (Döpfer 2005).
[9] What is called evolutionary economics has overlaps with innovation studies and behavioural and experimental economics. Methodologically, it uses the novel method of ABMs (§10.5).
Leave A Comment