Energy use: units
Energy units. It is important to get some familiarity with the units of energy quantities (stocks) and flows. The energy stored in systems is a stock. Examples are the chemical energy stored in a liter of gasoline, the heat content of a cup of tea or the kinetic energy of a moving car. The basic unit of an energy quantity is the joule (J). It is about one quarter of the traditional unit of heat: the calorie, which is defined as the amount of heat needed to heat one gram of water one degree Celsius in temperature. The joule is such a small unit that one usually measures it in thousands: kilojoule (kJ), millions: megajoule (MJ), billions: gigajoule (GJ), or trillions: petajoule (PJ) or exajoules (EJ – 1018 J). For instance, the amount of energy stored in one m3 of natural gas is the equivalent of about 36.000.000 joule or 36 MJ.
What makes the world go round are not energy stocks but energy flows, or power, that is: the quantity of energy that crosses a well-defined system boundary per unit of time. Ocean water evaporates by the heat flow of the sun, a cup of tea cools down as heat flows into the environment, the flow of falling water drives the turbine and a barrel of oil is taken out of the ground in order to let it react with oxygen in the air (‘burning’) and use the heat in the combustion gases. The basic unit of energy flow is the joule per second (J/s) or watt (W). One hour has 60 × 60 = 3.600 seconds, so if you burn one m3 of natural gas in the course of one hour, the energy flow equals 36.000.000/3.600 = 10.000 W or 10 kilowatt (kW). If the power is electrical power, the unit kWe is often used. A widely used unit for an amount of energy is the kilowatthour (kWh), which is defined as the energy content of delivering 1 kW of energy flow during one hour (1 kWh = 3,6 MJ). Table 17.A1 gives some values for energy stocks and flows associated with familiar processes and systems.
Units are conventions, describing well-defined systems and processes. Table 1 gives units and conversion factors. It should be realized that there are averages, e.g. coal quality can vary significantly and the energy content of a barrel (149 liter) depends on the widely varying crude oil density. Many units are derived from the fossil fuel industry, such as tons of coal equivalent (tce = 29,3 GJ) and tons of oil equivalent (toe = 41,9 GJ). A common unit in the oil industry is million barrels of oil per day Mbd (= 2204 PJ/yr = 69873 MW) and Mtoe/yr (= 41,9 PJ/yr = 1329 MW). Natural gas use is given in cubic meter (cm or m3 = 35,2 MJ). The (natural) gas-based unit is Bcm/yr (= 35,2 PJ/yr = 1116 MW). Upon entering the post-fossil-fuel era, it is better to let these units fade away and relate energy stocks and flows to the human scale and end-use functions:
- the maximum influx of solar energy on a clear day is in the order of 1000 W/m2, which translates in about XXm2 from photovoltaic panels;
- the human body is a heat engine of about 100 W (in rest) up to 500 W (at maximum power); one horsepower is approximately 735 W;
- most car engines fall in the range of 20-100 kW, heating installations in standard dwellings are in the order of 10-50 kW.
There is an abundance of websites with data on energy conversions, for instance www.unitconvertors.net, and use, for instance www.iea.org, https://yearbook.enerdata.net/ and www.bp.com.
| Energy content (stock) | Energy flow (power) | ||||||||
| Process | System | MJ | kWh | System | GJ/yr | kW | |||
| Combustion | 1 kg of coal | 29.3 | 8 | ton of coal per year (tce/yr) | 29,3 | 0,93 | |||
| 1 kg of crude oil | 41,9 | 11.6 | ton of oil equivalent per year (toe/yr) | 41,9 | 1,3 | ||||
| 1 barrel of crude oil | 5750 | 1597 | 1 barrel of oil per day (bd) | 66,55 | |||||
| 1 liter gasoline (petrol) | 34.7 | 9.6 | 1 liter of gasoline per day | 0,4 | |||||
| 1 liter bioethanol | 23.4 | 6.5 | 1 liter of bioethanol per day | x
|
x | ||||
| 1 m3 natural gas (CH4) | 36 | 10 | 1 ton of LNG per day | x | x | ||||
| 1 kg munic solid waste | 9.4 | 2.6 |
|
x | x | ||||
| 1 m3 hydrogen (H2) | x | x | |||||||
| Potential (lift/fall) | 1,000 kg water at 100 m | 1 | 0.3 | 75 kg body 270 m up on stairway (Eiffel) | 0.2 | 0.06 | |||
| Kinetic (move) | 20 ton truck at 90 km/hr | 0.3 | 0.1 | small car at 120 km/hr | 0.016 | 0.005 | |||
| Humans | One day body heat | 8.6 | 2.4 | 1 hr heavy work | 0,2 | ||||
| Animals | 6 hr horse work | 16.2 | 4.5 | 1 horse power (hp) | 0,745 | ||||
| Food | avg calorie intake/adult/day | 12 | 3.4 | 1 yr 1 soft drink can/day | 0.23 | 0.06 | |||
| Heat/cold | 500 litre water to 50◦C (bath) | 105 | 29.2 | 1 kg of ice at 0◦C | ? | ?
|
|||
Table 1 Some important energy and work units.
Energy use: Sankey diagrams
Global data hide the enormous differences across places and peoples. One way to show this is a focus on the national energy system for which usually the best or even only data are available. An illustrative representation are the so-called Sankey flow diagrams, in which the energy flows from the primary sources (left) to the end uses (right) are depicted [2]. As an illustration, I show the diagrams for the year 2016 for three countries: Zambia, Chile and The Netherlands (Figure 2). They have roughly the same number of inhabitants (17,5 mln in 2017) but a very different biogeography and level of economic activity (a ratio of 1:6,3:13,1 in PPP-based GDP). As is seen on closer inspection, the size of the flows is hugely different (a ratio of 1:3:6,54 in total final consumption). The nature of the flows is also different: whereas nearly all energy flows in Zambia are related to local use in households and small businesses, end-use in Chile is dominated by oil-for-transport and electricity. Zambia is still largely supplying its own energy (biomass, hydro), Chile has become very dependent on coal and oil)product) imports. In The Netherlands, energy flows are dominated by massive fossil fuel use and trade flows via Rotterdam harbor and the ‘natural gas roundabout’ around the Groningen and other natural gas fields. Thus, three populations similar in size but in different biogeographical and economic conditions show a huge variety in their energy systems.
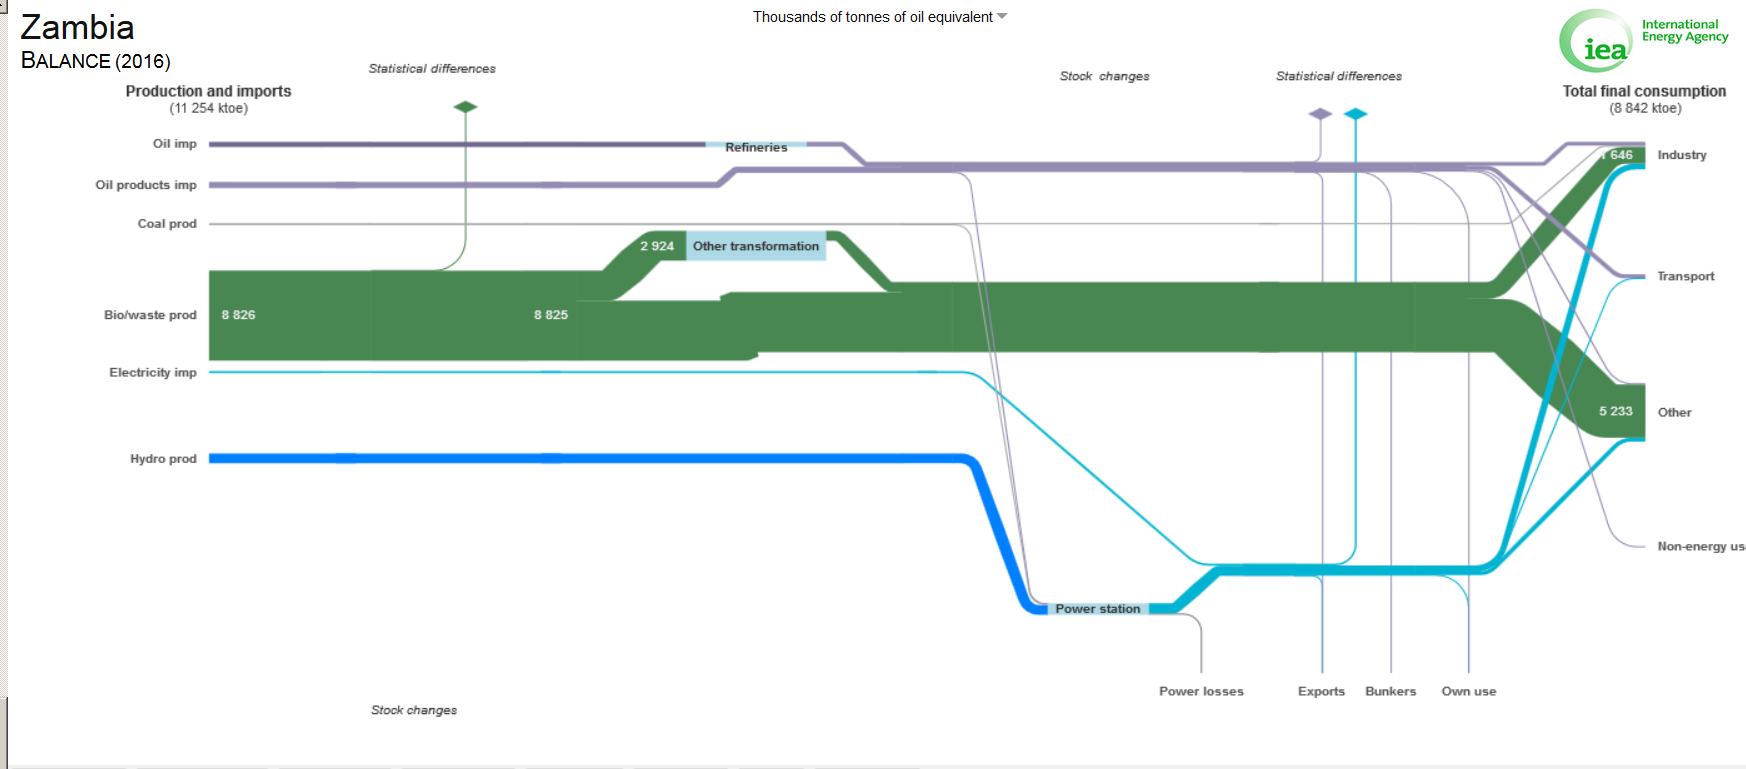
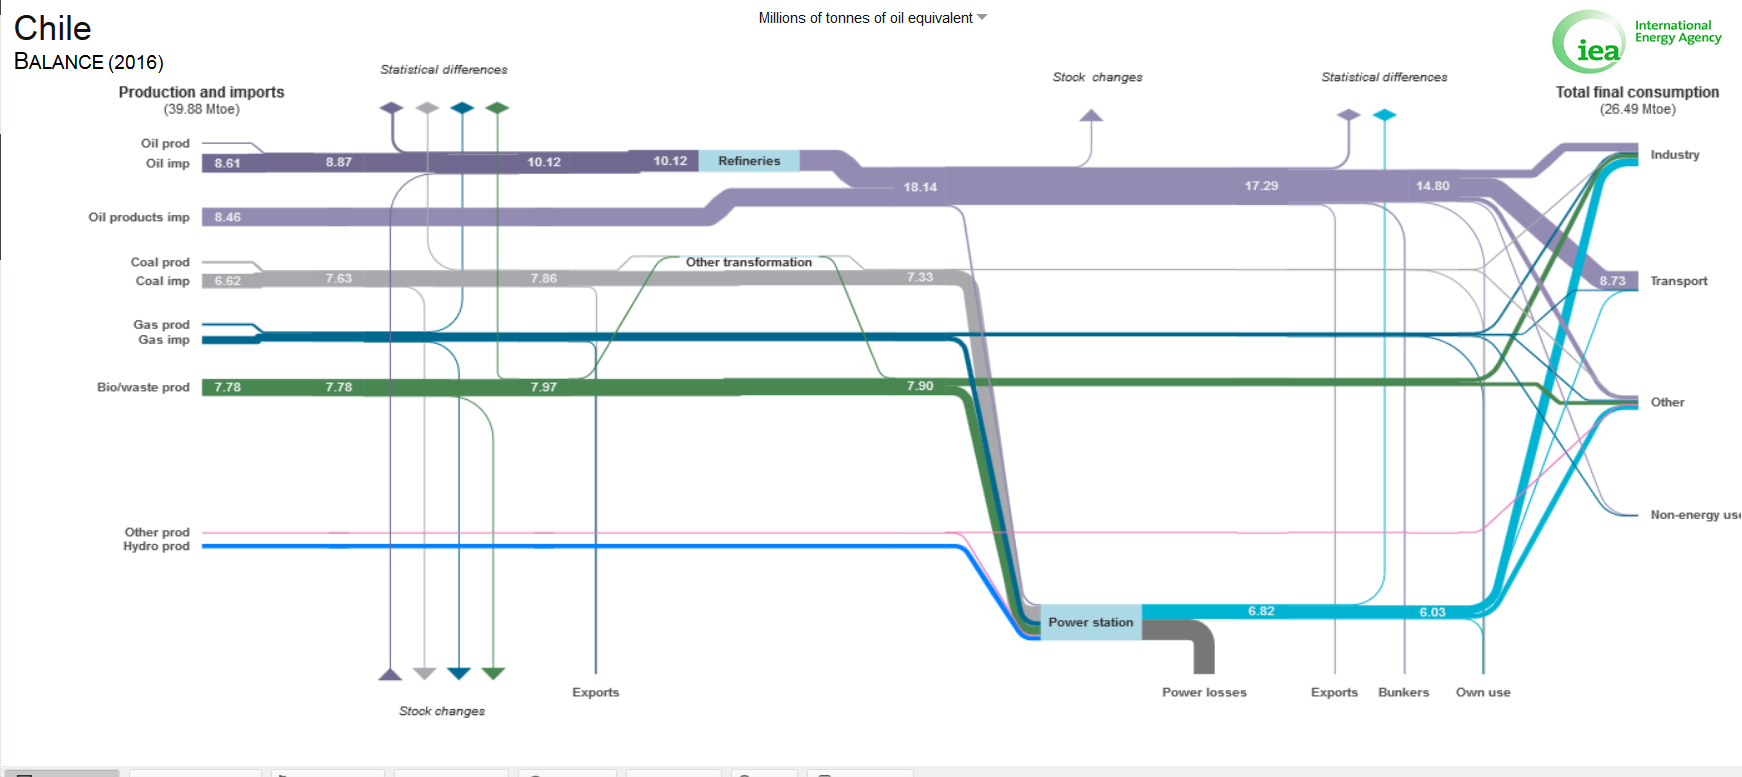
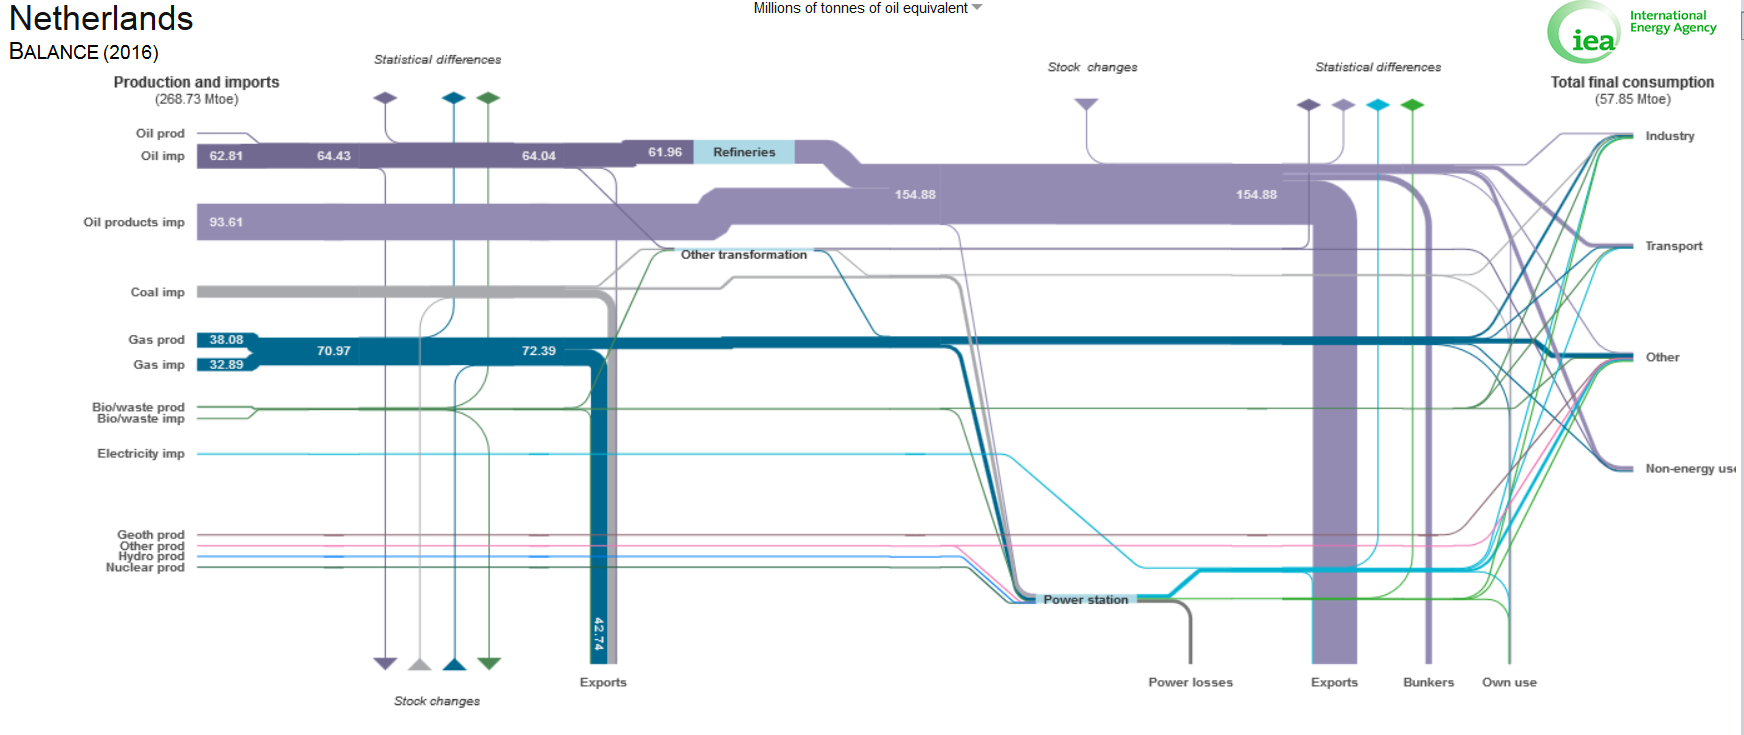
Figure 2 Annual energy flows in the form of Sankey diagrams for three countries with about the same population size: Zambia (upper left), Chile (upper right) and The Netherlands (lower) in 2016 (source: https://www.iea.org/Sankey/). Note the difference in scale: total final consumption was in Zambia 8,85 mtoe/yr, in Chile 26,5 mtoe/yr and The Netherlands 57,85 mtoe/yr. Note the colour code: grey = coal, green = bio/waste, blue = electricity; dark blue = gas, purple = oil (products).
As these figures show, even at an aggregate country level there are divergent uses and forms of energy. The usual distinction in statistics is between Industry, Transport, Other and Non-energy use (see e.g. www.iea.org). In terms of energy services, the dominant use categories are industrial and domestic heat, work for moving persons and freight, and electricity for industrial power and lighting. This too is illustrated with Sankey diagrams. For instance, as you can check on the site https://www.iea.org/Sankey/, inspection of the final consumption flowcharts for two countries with comparable populations: the USA with 330 mln inhabitants in 2019 and Nigeria with about the same number of inhabitants projected for 2040, shows some salient features:
- in Nigeria almost all energy in the sector Other flows to Residential and is almost entirely from biofuels and waste (101 mtoe/yr), whereas in the USA about half flows to Residential and half to Commercial and public services and it is for nearly 90% from electricity and natural gas (489 mtoe/yr);
- the sector Transport is almost exclusively road transport and depends in (still) oil-rich Nigeria entirely and in the USA for over 90% on oil (products), but energy use in the USA is almost 30 times larger than in Nigeria (625 mtoe/yr);
- the sector Industry uses in the USA about one fifth of energy use in all three sectors, largely in the form of electricity and natural gas for a dozen energy-intensive industries (262 mtoe/yr); in contrast, Nigerian industry uses less than half of what is used for transport, mostly from biomass and natural gas (7 mtoe/yr).
Such diagrams illustrate the huge differences in the role of energy on a country basis, reflecting equally huge differences in lifestyles, private and public services, economy and employment.
Literature
Blok, K., and E. Nieuwlaar (2020). Introduction to Energy Analysis. Routledge
MacKay, D. (2009). Sustainable Energy- without the Hot Air. UIT Cambridge UK
Footnotes
[1] The word ‘stored’ is not completely adequate, in the sense that it is stored in the 1 m3 of natural plus the 10 m3 of air and, as part of, the 2 m3 of oxygen that together give on combustion a heat flow of 36 MJ.
[2] These diagrams can be looked up for many countries and from 1973 onwards on the site of the International Energy Agency (https://www.iea.org/sankey/).[/fusion_builder_column][/fusion_builder_row][/fusion_builder_container]
Leave A Comment